Teaching Graphing in FDK
year my kids find graphing super fun and engaging but teaching JK/SK (that’s
Pre-K/K for my American friends) it was always hard to make this an independent
centre.
This year I found a solution that worked well!
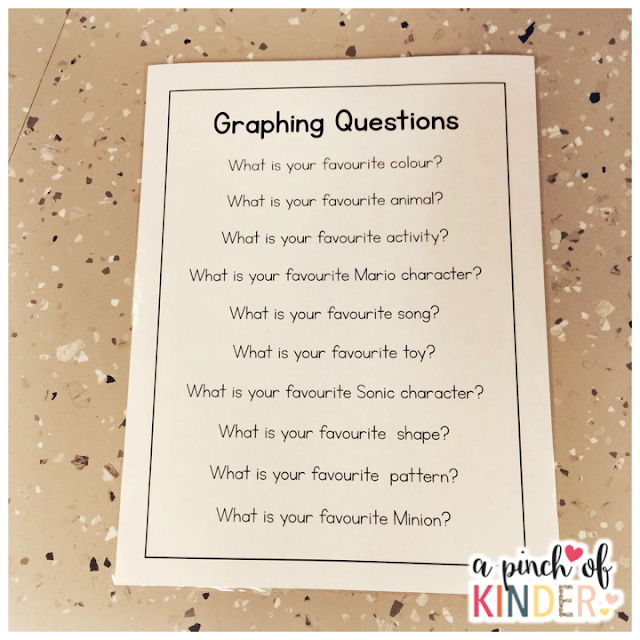
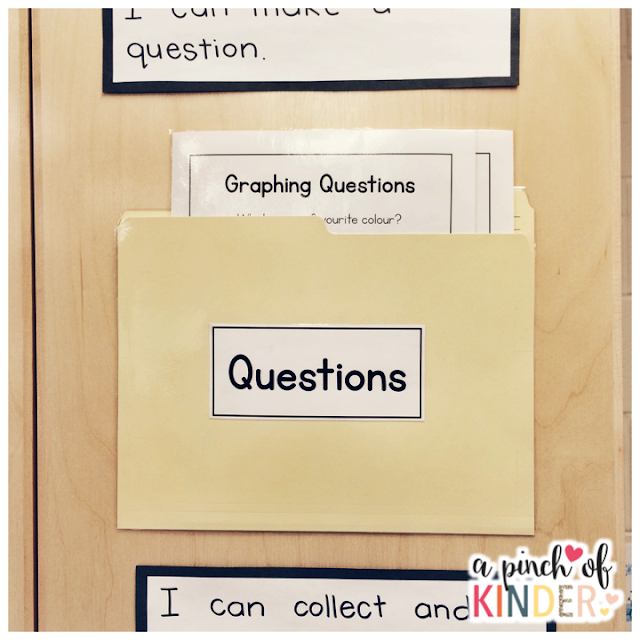
Then I typed up the questions and laminated a couple copies to keep in our question folder so that the students can reference them if they need help coming up with a question.
I was going to start with a concrete graph (in theory that might be better) but I have a higher group of kiddos than usual this year and I wanted to introduce the graphing papers that we they would be using at the graphing centre so I could open it that day.
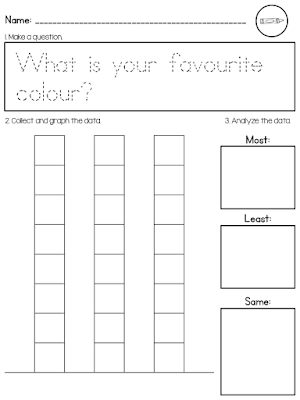
So I put this graphing paper up on the smart board
and we went through the steps together.
First we read the question together and I showed them how to trace the question. Then we picked three colours for the choices. We talked about we could do a small scribble with crayon to indicate our colour choices if copying colour words from the word wall was too tricky. I also told them that even if they can copy the colour word to do a small dash of the colour with crayon underneath to help them remember what is what. Then I modelled how to ask the question to each student in the class and add the data to the graph.
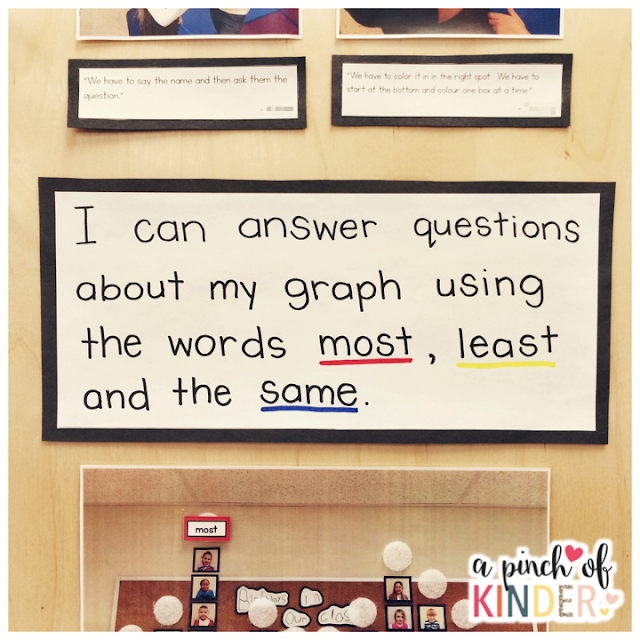
At the end we talked about which colour was the most popular, least popular and if any were the same.
I left out this paper with clipboard, pencils and crayons for the kids to try.
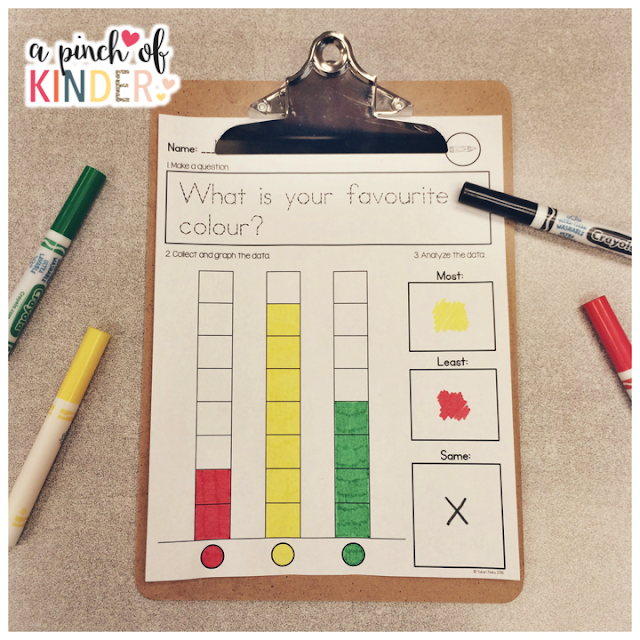
Here is an example of a completed “What is your favourite colour?” page.
I told the kids that if there were no colours that were the same they could either put an X or write “none”.
The kids also used these “Photo Class List”‘s to keep track of who they’ve asked. As they asked their question and graphed their data, they crossed out the person they asked.
On the third day we made our first concrete graph.
First we reviewed that the first step was to make a question.
I told them that the question we are going to answer and graph today is “What is your favourite animal?”
I then quickly taped 5 different animal pictures around the room. Then I had the students move to the picture of their choice.
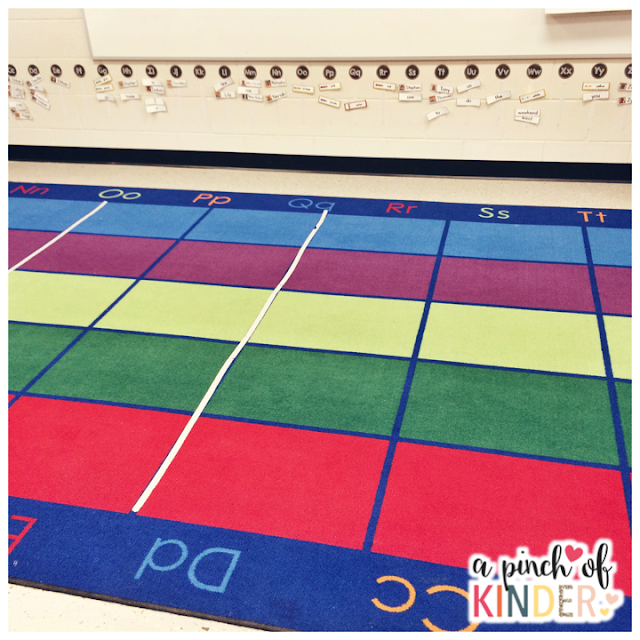
Then we called 1 group at a time and graphed the kids on the carpet.
We have the perfect carpet for this as our carpet is a grid!
We had the person at the front hold the animal picture, took a picture with the iPad and showed the image on the SMARTBoard. Then we talked about which one was the most, the least and the same.
Here is a sample of an favourite animal graph they could complete at centre time:
On the fourth day we made another concrete graph. This time we graphed siblings in our class! We followed the same steps as favourite animal but I taped the signs for “sisters only”, “brothers only”, “brothers and sisters” and “no siblings” instead. The rest was the same as the third day 🙂
On the fifth day we created our birthday graph! First I had some of my kiddos write the months of the year for me. Then I put them up on the bulletin board. Then I printed out a square picture of each of my kiddos and mounted it on black construction paper. Then we added the pictures during whole group math time and we talked about which month has the most birthdays, which month has the least birthdays and if any of the months have the same.
All of the printables above can be found in my newest product, Graphing for Little Learners!
You can click on the image below to check it out in my TPT store 🙂


