

Digital Math for Kindergarten | Graphing Activities | Google Slides™
Number of Pages: 24
File Type(s):
- Google Apps
$2.00
Save with a Bundle!
This product can also be found in:
-
Sale!
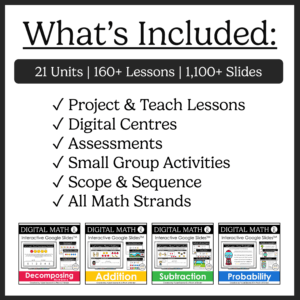
Year-Long Digital Kindergarten Math | Google Slides™ Math Bundle
Original price was: $185.00.$109.00Current price is: $109.00. -
Sale!
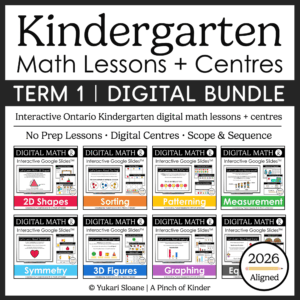
Ontario Kindergarten Digital Math Bundle | Term 1 Google Slides™ Lessons
Original price was: $66.00.$52.00Current price is: $52.00. -
Sale!
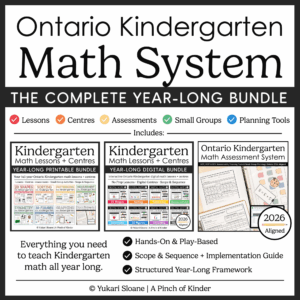
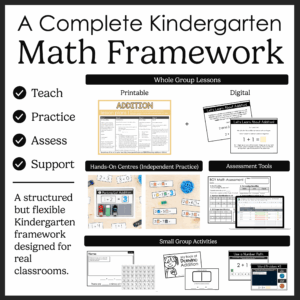
Ontario Kindergarten Math System | Year-Long Curriculum | Printable + Digital
Original price was: $478.00.$260.00Current price is: $260.00.


Digital Math for Kindergarten | Graphing Activities | Google Slides™ | Ontario 2026 Aligned
Looking for interactive kindergarten graphing activities you can use for digital math centres, whole-group lessons, or distance learning?
This Google Slides™ graphing resource gives your students hands-on drag-and-drop practice collecting data, organizing information into picture graphs, and analyzing results using the words most, least, and same.
Reviewed and verified for alignment with the Ontario 2026 Kindergarten Math Curriculum
Perfect For:
✔ Whole-group teaching on SMARTBoard
✔ Digital math centres
✔ Google Classroom assignments
✔ Small-group instruction
✔ Distance learning
✔ Hybrid classrooms
What’s Included:
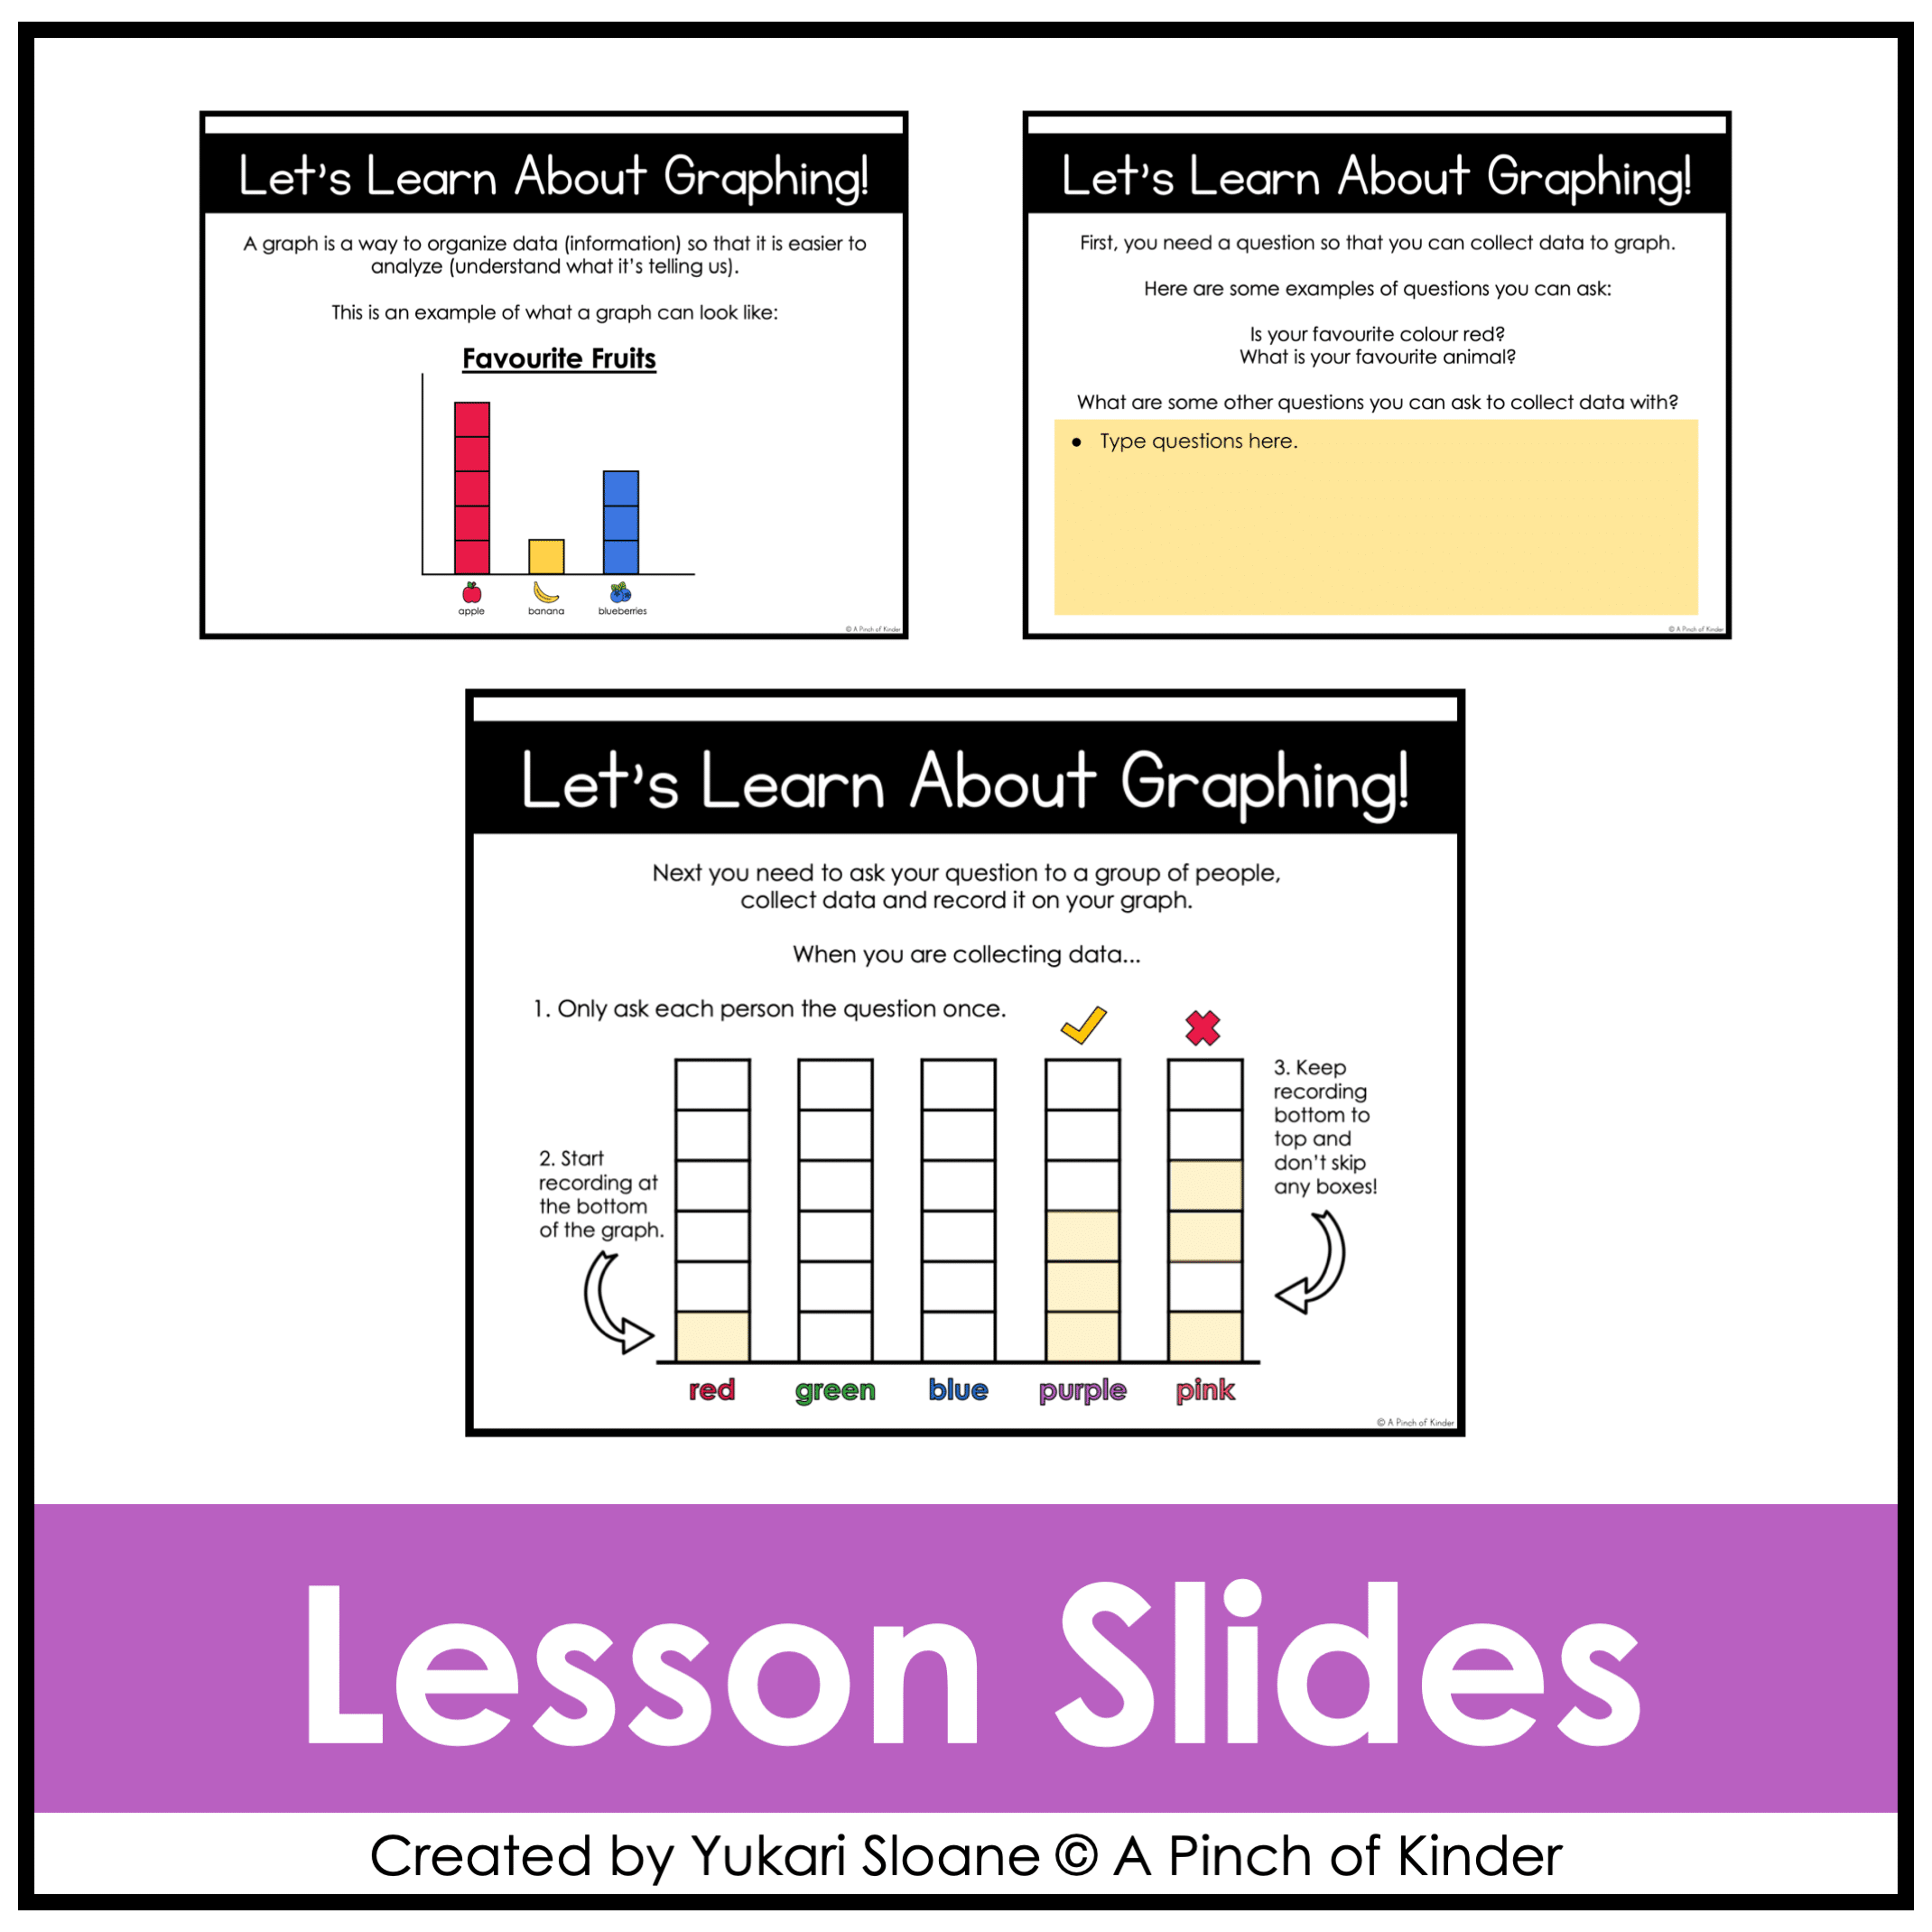
⭐ Lesson Slides: What Is Graphing? (Slides 1–3)
Introduce and teach:
- What is a graph?
- What does a graph look like?
- How do we record data?
- Brainstorming graphing questions
- Rules for collecting and recording data
👆 Use these slides for direct instruction before interactive practice.
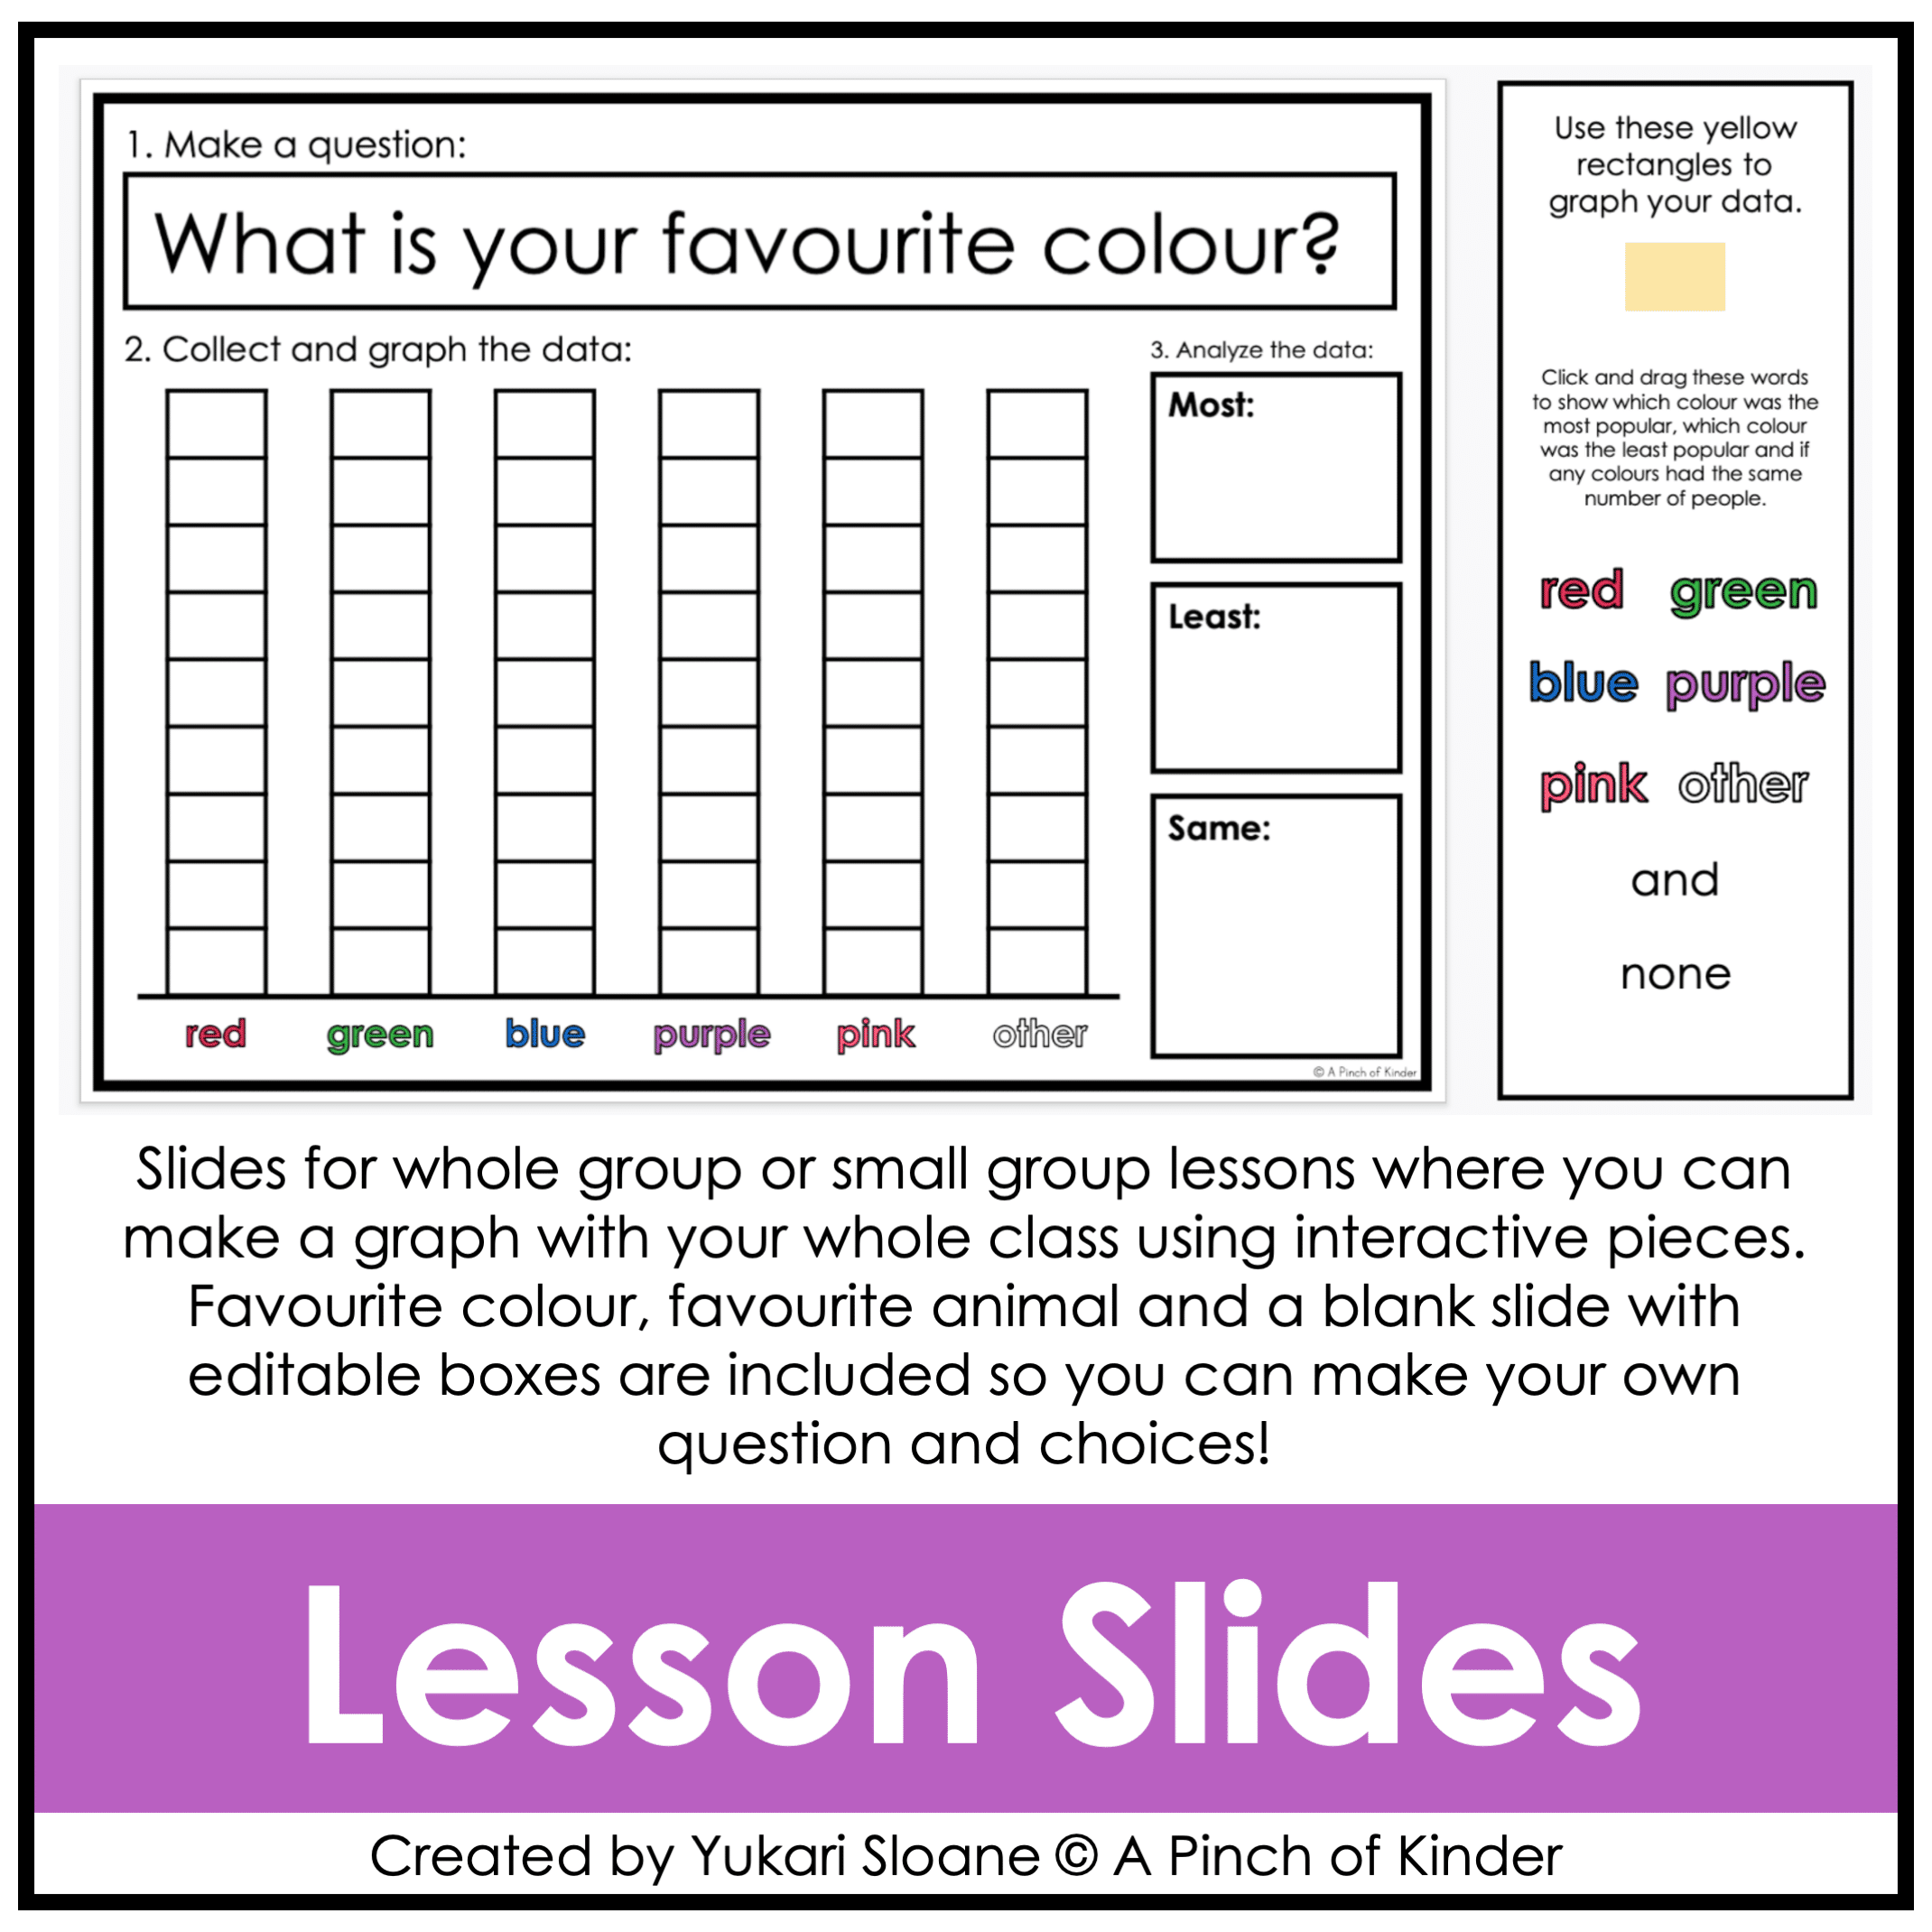
⭐ Interactive Graphing Templates (Slides 4–6)
Designed for whole-group or small-group instruction.
Students:
- Answer a graphing question
- Click and drag yellow rectangles to the correct column
- Work together to analyze the results
- Drag the correct answers into response boxes
Includes:
- What’s your favourite colour?
- What’s your favourite animal?
- Editable blank template to type your own question and answer choices
Perfect for modeling how to collect and organize classroom data.
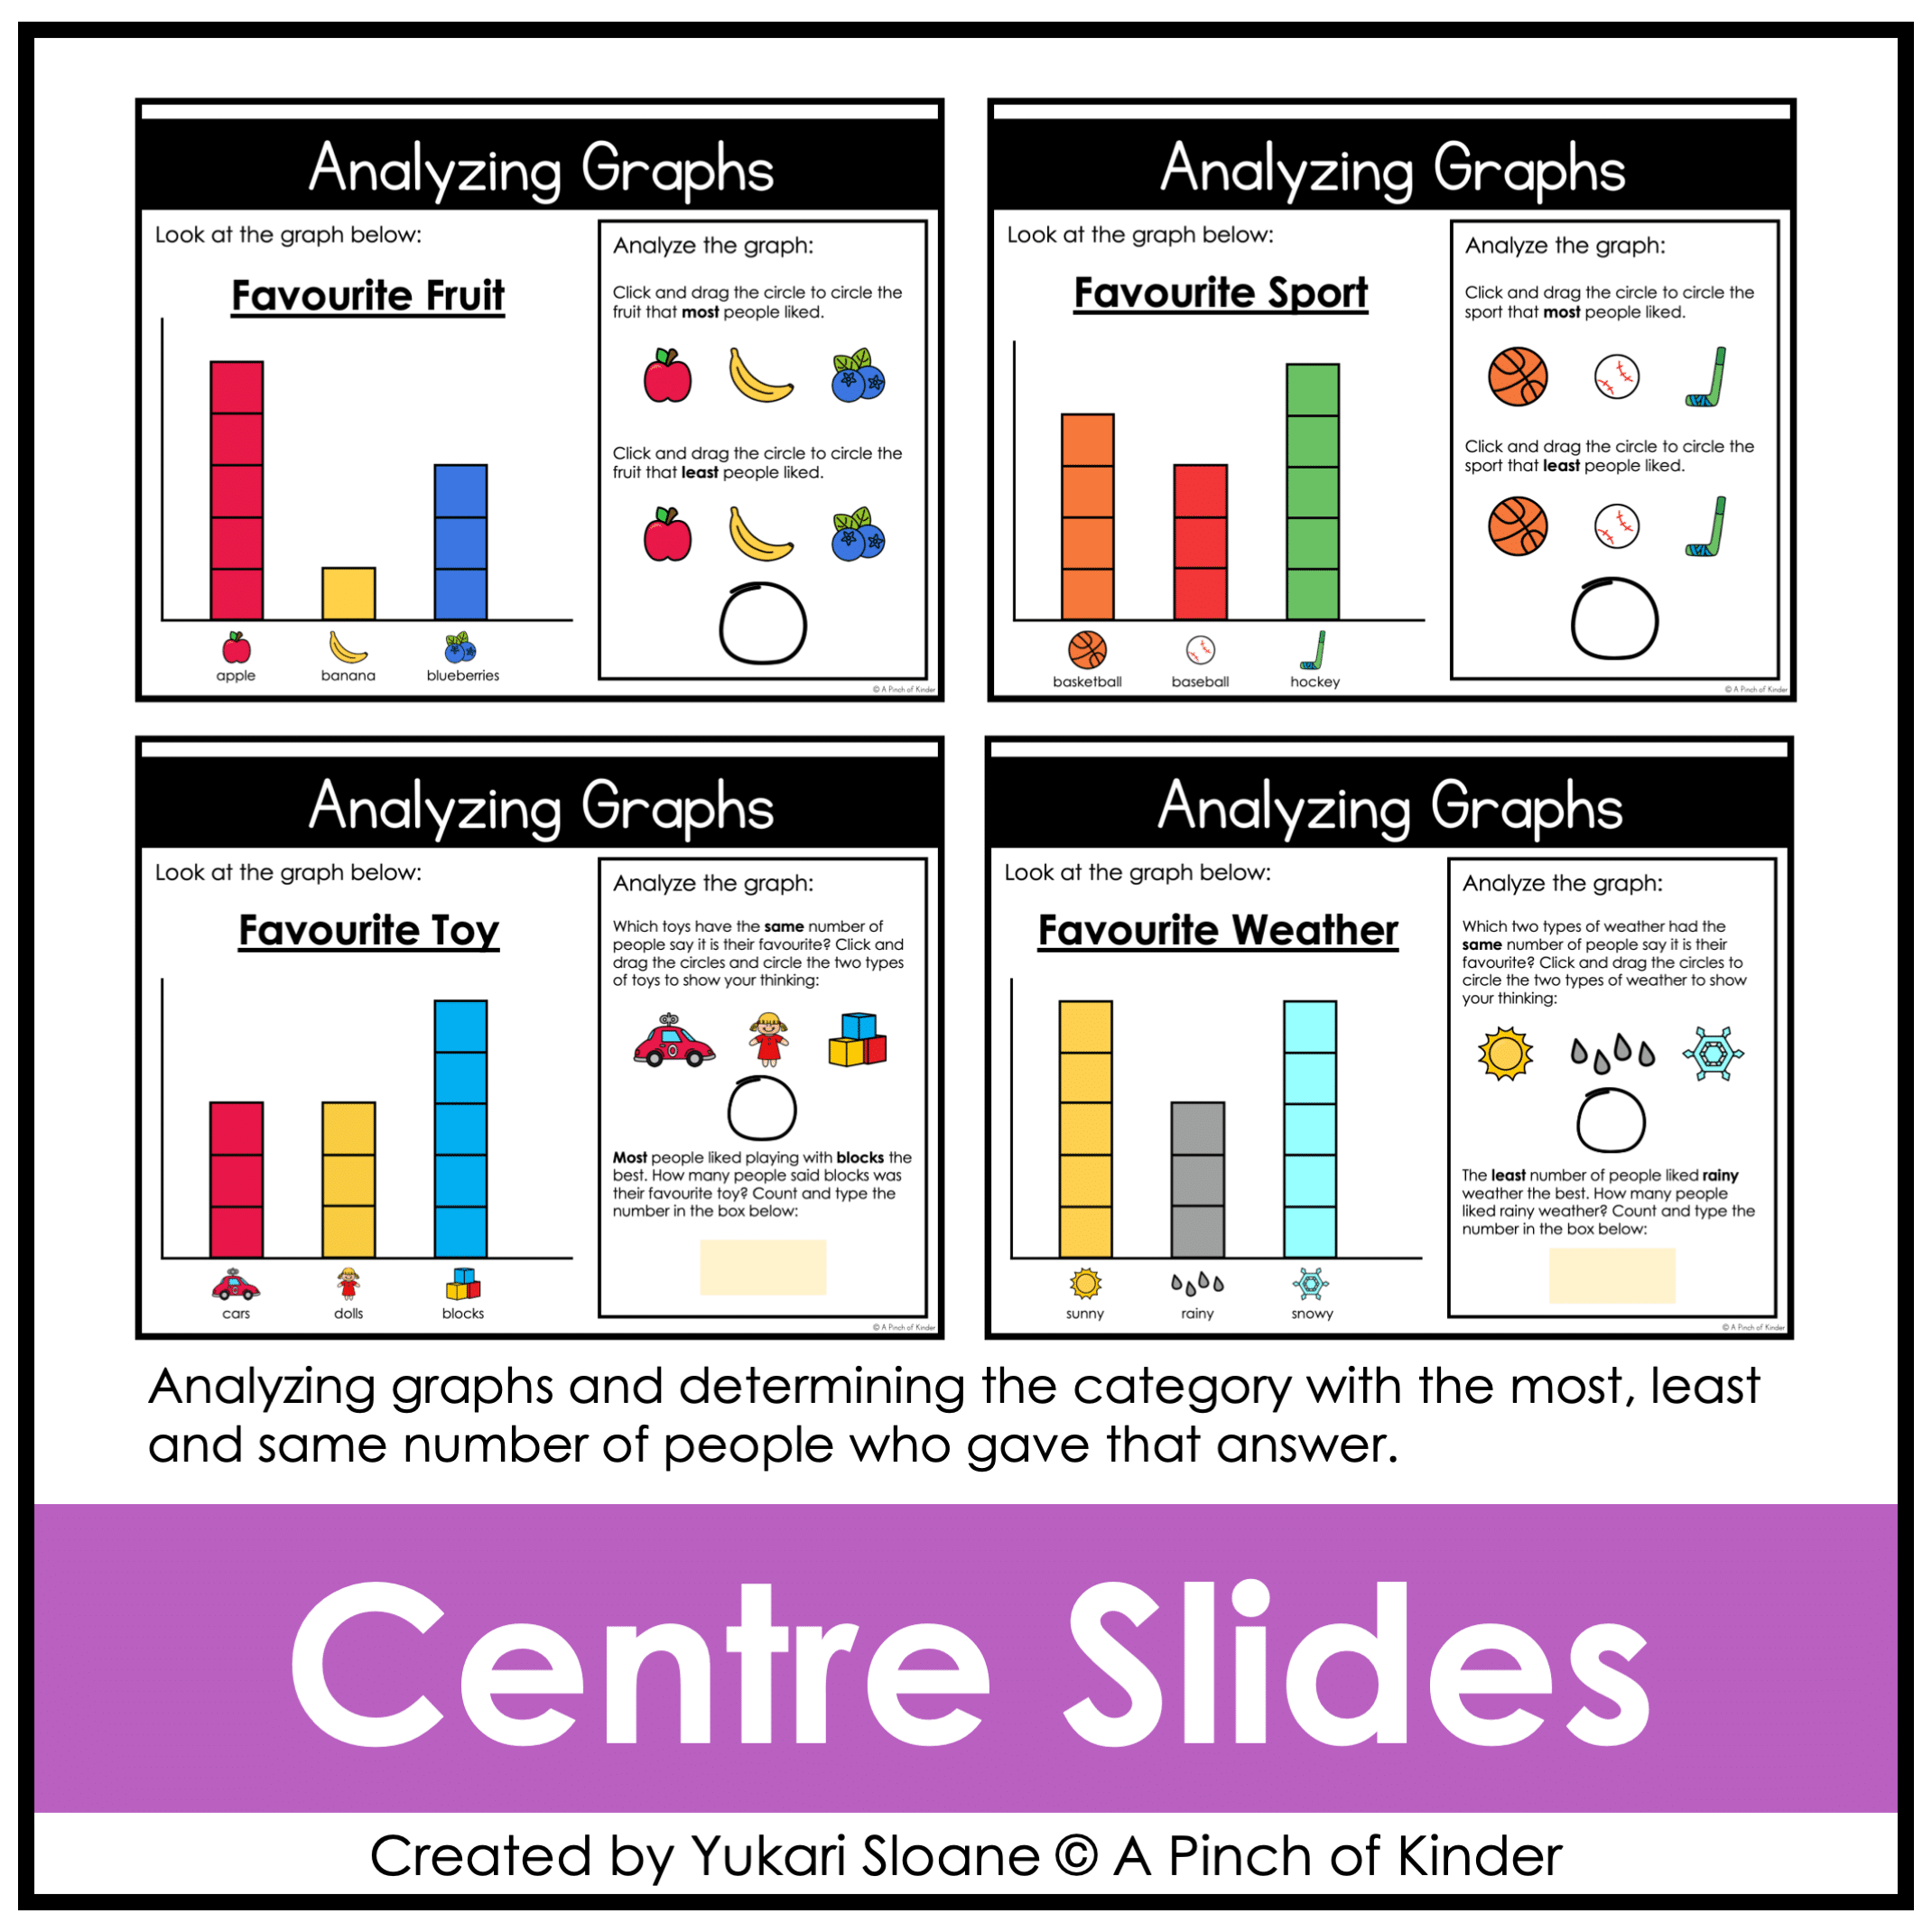
⭐ Analyzing Graphs – Most & Least (Slides 7–10)
Students:
- Look at pre-made picture graphs
- Identify which category has the most
- Identify which category has the least
- Drag circles to highlight correct answers
Builds data interpretation skills and vocabulary.
⭐ Analyzing Graphs – Same & Comparing Quantities (Slides 11–14)
Students:
- Identify which two categories have the same amount
- Drag circles to highlight matching quantities
- Count and type totals for most or least categories
Integrates:
✔ 1:1 correspondence
✔ Number identification
✔ Comparing quantities
Why Teachers Love This Resource:
✔ No prep — just assign or project
✔ Engaging drag-and-drop format
✔ Builds real data analysis skills
✔ Reinforces most / least / same vocabulary
✔ Supports early number sense
✔ Works for in-person OR digital classrooms
✔ Ontario-aligned
Ontario Kindergarten Curriculum Alignment:
This unit supports these data literacy expectations:
- A8.2 collect and record data to answer questions of interest, and display it in concrete graphs or picture graphs
- A8.3 respond to data in concrete graphs and picture graphs by interpreting it and drawing conclusions
Students:
- Collect and record data
- Display data in picture graphs
- Interpret results
- Draw conclusions using appropriate math language
No changes were needed for 2026 alignment — this resource fully supports current expectations.
Tech Tips:
- Use in EDIT mode (not Present mode) so movable pieces work.
- If assigning in Google Classroom, students using iPads/tablets must have the Google Slides app installed to manipulate pieces.
- You may also download the file as a PowerPoint to use on a SMARTBoard.
Separate slide decks are included for:
- Canadian spelling (colour/favourite)
- American spelling (color/favorite)
Please use the version that works best for your classroom.
Try Before You Buy!
Not sure if this interactive format works for you?
Grab my FREE Digital Math for Kindergarten | Tally Marks | Google Slides™ to test it out.
If you love this resource, be sure to check out my other Digital Math for Kindergarten units or my complete year-long digital math program💛